Growth Levers and How to Find Them by Matt Lerner
Rating: 7/10
Date Read: August 10, 2025
My Thoughts
I definitely liked the book. I read it with my personal projects in mind and how to grow them, but it wasn’t super applicable for me because my projects are in very early stages—no revenue, no customers, no employees. Although a few pieces of advice were definitely useful to consider, they weren’t directly applicable to my current situation.
At the same time, since I work at Readwise, and this book is definitely more suited for a company like this, it was useful for thinking about growth levers for Readwise specifically and the frameworks that could be beneficial. This is especially relevant because I work as a growth analyst there, so thinking about applying some of those concepts would be very valuable.
I have yet to implement any of these ideas since I was using Readwise to read the book and made numerous highlights that I can revisit and analyze—which should be very useful for the company. I think in general, if any of my personal projects do become successful in the future, this book would prove quite valuable.
Summary
Growth Levers and How to Find Them argues that early-stage growth comes from a tiny set of outsized levers, not from doing lots of small things a bit better. Startups win by becoming instruments of discovery—learning faster who the right customers are, what value they want, where to reach them, and which few tactics drive step-change outcomes. Effort and complexity don’t pay; outcomes and insight do.
Lerner’s system has four parts: understand the customer journey (Struggle → Search → Selection), map a growth model (North Star Metric, key drivers, levers, and the rate-limiting step), run rapid growth sprints (hypothesis-driven experiments that favor big learning), and shift culture from optimization to discovery. Do fewer, bigger things; align the company on a simple dashboard; and expect a non-linear path of “nothing…nothing…bang!”
Learnings
- Outcomes over effort; do fewer, bigger things that move the needle.
- Early stage: discovery for step-changes beats optimization for marginal gains.
- Map the journey (Struggle → Search → Selection) and match tactics to stage.
- Use “Jobs to be Done” interviews with recent buyers/substitutes to uncover triggers and anxieties.
- Anchor on a simple, absolute North Star Metric that rises with delivered customer value and revenue.
- Define key drivers as outcome metrics across the funnel; avoid counting activities.
- Turn drivers into levers with outcome targets; track via a simple, shared dashboard.
- Find the rate-limiting step—if doubling it would double the business, focus there.
- Prioritize by potential impact, learning value, effort, strengths, and feedback loops.
- Run growth sprints: score (Key driver, Impact, Effort), test quickly, learn, repeat.
- Write falsifiable hypotheses (risky assumption → experiment → predicted metric change → business decision).
- Minimize complexity; progress is non-linear (“nothing…bang”)—if you’re learning, you’re on track.
‘How to Read a Book’ Analysis
Key Sentences
-
“If you look back at the early days of any great startup, you’ll see that 90% of their growth came from 10% of the stuff they tried.”
- Why it’s crucial: States the power-law nature of startup growth—few levers drive most results.
- Proposition: Focus resources on identifying and doubling down on the small set of tactics that produce outsized impact.
-
“Therefore, to succeed, an early-stage startup needs to become an instrument of discovery.”
- Why it’s crucial: Core prescription of the book: learning speed and quality determine success.
- Proposition: Structure teams, processes, and metrics to maximize validated learning, not output or effort.
-
“But discovery isn’t about getting marginally better; it’s about becoming categorically different.”
- Why it’s crucial: Distinguishes discovery from optimization and reframes goals as step-changes, not tweaks.
- Proposition: Seek binary, model-shifting insights (new segments, channels, propositions) over incremental improvements.
-
“A growth model is a flow chart that maps out how your business finds, acquires, and delights new customers.”
- Why it’s crucial: Introduces the central tool that aligns teams and reveals leverage mathematically.
- Proposition: Use an “North Star Metric” with key drivers and metrics to direct investment toward the highest-impact constraints.
-
“To do that, you’ll study the data and find your rate-limiting step: a bottleneck that constrains the overall growth rate of your business.”
- Why it’s crucial: Provides a focusing mechanism for action.
- Proposition: Identify and remove the RLS first (if doubling it doubles the business), then repeat as the bottleneck moves.
Unity of the Book
Startup success depends on becoming an instrument of discovery that rapidly identifies and exploits a few outsized growth levers—by deeply understanding customer struggle and decision paths, modeling the business to reveal bottlenecks, and running bold, learning-driven experiments—so scarce resources produce step-change outcomes rather than incremental gains.
Author’s Problems
Main Problem
How can early-stage startups reliably achieve step-change growth with scarce resources by discovering and exploiting a few outsized levers, instead of wasting effort on incremental optimization and complexity?
Supporting Problems
- How to model the business to reveal leverage and bottlenecks (define a North Star Metric, key drivers, levers, and the rate-limiting step).
- How to understand the customer journey (Struggle → Search → Selection) to surface real triggers, channels, objections, and switching costs.
- How to generate, prioritize, and test growth ideas quickly (growth sprints, KIE scoring, rigorous hypotheses, and learning loops).
- How to obtain high-quality qualitative insight (“Jobs to be Done” interviews with recent buyers/substitutes) to inform hypotheses and uncover non-obvious channels.
- How to align teams and metrics around outcomes rather than activities (simple dashboards, outcome targets, avoid the “complexity tax”).
- How to choose and stress-test a North Star Metric that aligns customer value with revenue and covers the full funnel.
- How to build and sustain a discovery mindset (embrace uncertainty, reduce confirmation bias, run toward surprises, accept non-linear progress).
- How to re-sequence focus as constraints move (shift attention when a key driver improves and the bottleneck changes).
Problem Hierarchy
First, adopt a discovery mindset to enable bold, evidence-seeking work. Next, understand customers via “Jobs to be Done” and the Struggle → Search → Selection journey to ground hypotheses. Then map the growth model (“North Star Metric”, key drivers) and identify the rate-limiting step to focus resources. With focus established, run growth sprints to test high-upside ideas rapidly, using outcome metrics and a shared dashboard to align the team. Finally, iterate as bottlenecks move and persist through non-linear progress.
Book’s Structure
- Overview of Major Parts/Sections
- No Prizes for Effort: Frames the core problem—early growth follows a power law, so activity and complexity don’t matter; discovery and leverage do.
- The Solution: Discovery Mode (overview): Introduces the 4-step system—Customer Journey, Growth Model, Growth Sprints, Mindset Shift.
- Understanding the Customer Journey: Deep dive into Struggle → Search → Selection; how to match tactics to stage.
- Jobs To Be Done Interviews: Method to extract real triggers, anxieties, and decision context that power the journey.
- Mapping Your Growth Model: How to define NSM, key drivers, levers, and find the rate-limiting step; align work via dashboards.
- Running Growth Sprints: Process for prioritizing, experimenting, learning; hypothesis discipline and scoring ideas.
- Shifting the Mindset: Cultural changes required to sustain discovery—intellectual honesty, boldness, embracing failure.
- When Nothing Is Working: Normalizes non-linear progress and reinforces persistence in discovery.
- How the Parts Work Together
- The book moves from problem framing (why discovery) to a compact operating system (what to do), then into toolkits for each pillar (how to do it), and finally into culture and persistence (who you must be and how to endure). Each later section depends on the clarity and inputs generated by earlier ones (e.g., JTBD insights feed the growth model and experiments), creating a closed learning loop.
- Hierarchical Outline
- I. Problem Framing
- A. No Prizes for Effort (power law, complexity tax, discovery vs optimization)
- II. Solution Overview: Discovery Mode
- A. Step 1: Understand Customer Journey (Struggle → Search → Selection)
- B. Step 2: Map Growth Model (NSM, key drivers, levers, RLS)
- C. Step 3: Run Growth Sprints (hypothesis-driven testing)
- D. Step 4: Shift Mindset (discovery culture)
- III. Deep Dives and Methods
- A. Customer Journey
-
- Struggle, Search, Selection stages
-
- Matching tactics to stage
-
- B. JTBD Interviews
-
- Recent buyers/substitutes
-
- Extract triggers, anxieties, switching costs; channel insights
-
- C. Growth Model
-
- NSM criteria and examples
-
- Key drivers (outcomes vs activities)
-
- Sketching the model; dashboards
-
- Levers with outcome metrics
-
- Rate-Limiting Step (RLS) test
-
- D. Growth Sprints
-
- Inputs → Ideation/Scoring (Key driver, Impact, Effort) → Selection
-
- Experiment design; falsifiable hypotheses; negative framing
-
- Learn, document, iterate; bottleneck shifts
-
- A. Customer Journey
- IV. Culture and Persistence
- A. Shifting the Mindset (openness, boldness, run toward surprises)
- B. When Nothing Is Working (expect “nothing…bang” curve; keep learning)
- How This Structure Serves the Main Purpose
- The structure operationalizes the central thesis—win by discovery and leverage—by sequencing the reader through why (motivation), what (framework), how (methods and metrics), and who/how long (mindset and persistence). Each part produces inputs for the next (JTBD → model → experiments → new insights), forming a self-reinforcing loop that consistently exposes and exploits the few levers that drive step-change growth.
Prompt / Agent Ideas
-
Struggle Signal Miner (forums) Prompt: “Scan Reddit, X, Hacker News, and product forums for complaints/questions about {{job-to-be-done}} among {{segment}}. Cluster by theme; extract triggers, failed alternatives, anxieties, and urgency signals. Output CSV: theme, trigger, quote, link, frequency, severity (1–5), opportunity hypothesis.”
-
JTBD Interview Kit Generator Prompt: “Create a JTBD interview guide for recent buyers of {{product/substitute}}. Include screener questions, consent intro, timeline walkthrough, forces (push, pull, anxieties, habits), switching costs, and wrap-up. Add a one-page note-taker template.”
-
JTBD Transcript Analyzer Prompt: “Given these interview transcripts, reconstruct the decision documentary: timeline (first thought → passive look → active look → choice → first use), jobs, triggers, anxieties, hiring/firing criteria, alternatives tried, non-obvious channels. Output: job stories and a forces diagram per interview.”
-
Customer Journey Map (Struggle → Search → Selection) Prompt: “For {{segment}} considering {{product}}, map the journey by stage: core questions, tipping points, channels visited, proof required, objections, switching costs, and ‘moments that matter’. Recommend stage-specific messages and assets.”
-
Message Map by Stage Prompt: “Draft messaging for Struggle (pain-pokes), Search (comparison/SEO topics), and Selection (risk-reversals). Provide 3 ad variants, 3 email subjects, landing page hero copy, and proof assets per stage.”
-
Growth Model Builder Prompt: “Propose a North Star Metric for {{product}} and 3–4 key drivers that causally move it. Sketch a funnel model with absolute counts and conversion rates. List 8–12 levers under each driver with associated outcome metrics.”
-
NSM Stress Test Prompt: “Evaluate this NSM: {{NSM description}} against criteria: aligned incentives, full-funnel, absolute, simple/memorable. Suggest better alternatives and explain trade-offs.”
-
Rate-Limiting Step Finder Prompt: “Given these metrics (visitors, signup rate, activation rate, 8-week retention, referral rate, ARPU), run a ‘doubling test.’ If each driver doubled, how would {{NSM}} change? Identify the bottleneck, explain why, and recommend top 5 levers to attack it.”
-
Lever Ideation Sprint (by driver) Prompt: “Generate 30 lever ideas for improving {{driver}} for {{segment}}. Tag each with hypothesis, expected impact, evidence source, dependencies, estimated effort (S/M/L), risk level, and learning value.”
-
Backlog Scoring (KIE/ICE) Prompt: “Score these ideas on Key driver fit, Impact (1–5), Effort (1–5), and Learning value (1–5). Return ranked list with ‘why’ notes and a shortlist for this sprint.”
-
Hypothesis Writer (negative framing) Prompt: “Transform this idea into a rigorous hypothesis: Risky assumption (negative form), Experiment design, Primary metric with predicted delta and direction, Guardrail metrics, Stopping rule, and Business decision if confirmed/invalidated.”
-
Experiment Design & Tracking Plan Prompt: “Design a valid test for {{idea}}: allocation, minimal detectable effect, sample size and duration, success criteria, confound controls, and event tracking schema (names, props). Provide SQL/pseudo-SQL for primary KPI.”
-
Quick-Win Filter (“Just do it”) Prompt: “From this backlog, identify items that are low-cost, low-risk, and reversible. Provide the smallest shippable version and expected time-to-impact.”
-
Post-Experiment Learning Synthesizer Prompt: “Given experiment results (metrics/notes), explain what happened, why, what we learned about users, what to scale/stop, follow-up tests, and any KPI definition changes. Create a one-paragraph ‘decision memo’ and a changelog entry.”
-
Dashboard Spec (Metric Tree) Prompt: “Create a dashboard spec with {{NSM}} at top, then key drivers, then nuance metrics. Define each metric, owner, update cadence, alert thresholds, and SQL/dbt model stubs.”
-
Cohort & Activation Analysis Prompt: “Analyze retention cohorts (by signup week/segment). Identify behaviors within first 7 days that correlate with 8-week retention. Propose an activation event definition and 5 onboarding changes to increase that behavior.”
-
Onboarding Redesign Kit Prompt: “Propose a first-session flow and 14-day lifecycle messaging for {{segment}}. Include checklist tasks, habit loops, empty-state copy, aha-moment timing, and 5 in-app nudges tied to activation predictors.”
-
Objections & Proof Asset Planner Prompt: “List top Selection-stage objections and switching costs for {{segment}}. Recommend proof assets (comparison pages, ROI calculator, demo video outline, migration guide, security FAQ) and where to deploy them.”
-
SEO Templates at Scale Prompt: “Identify {{market}} ‘Search stage’ keyword patterns (e.g., ‘{{task}} template’, ‘best {{tool}} for {{use case}}’). Produce a page template with variable slots, internal linking plan, and content brief for 10 programmatic pages.”
-
Referral Loop Design Prompt: “Design a referral program: moments to ask, incentive structure, eligibility, fraud prevention, copy variants, and a simple K-factor model. Include instrumentation and guardrails.”
-
Pricing Page Optimization Prompt: “Audit pricing page for clarity, risk reversals, and choice overload. Propose 5 high-variance tests (plan naming, default selection, toggles, money-back guarantees, social proof placement) with hypotheses.”
-
Complexity Tax Audit Prompt: “Inventory features/campaigns and estimate maintenance cost vs. usage/impact. Recommend deprecations, consolidations, and a simpler value prop statement. Output: ‘stop/keep/simplify’ table.”
-
Weekly Growth Meeting Pack Prompt: “Prepare an agenda: NSM and driver deltas, anomalies, RLS status, top 5 proposed experiments, decisions needed, risks, and owners. Include a one-slide summary and next-week commitments.”
-
Competitive Funnel Teardown Prompt: “Analyze {{competitor}}’s Struggle/Search/Selection tactics: messages, channels, proof assets, onboarding. Identify gaps and counter-moves tailored to our {{segment}}.”
-
Non-Obvious Channel Finder (Obituary heuristic) Prompt: “Using triggers uncovered in JTBD, list 10 unconventional placements where these triggers co-occur (events, newsletters, marketplaces, offline moments). Score by audience fit, CPM proxy, and expected intent.”
-
Sensitivity Simulator Prompt: “With this baseline funnel, simulate effects of ±10–100% changes in each driver on {{NSM}} and revenue. Return a tornado chart table and a recommended focus order.”
-
Data Gap Mapper Prompt: “List missing data and tracking that block good experiments. Produce a tracking plan (events, properties, IDs, sources), owner, and Jira tickets.”
-
Compliance-Friendly Growth (if regulated) Prompt: “Map compliance requirements that touch the journey (KYC, consent, PCI, HIPAA). Propose low-friction designs and copy to keep activation high while meeting obligations.”
-
B2B Buying Committee Map Prompt: “For {{B2B segment}}, map personas (economic, technical, user, legal). For each, list goals, fears, proof required, and craft a 3-email sequence to move deals through Selection.”
-
“Nothing…Bang” Progress Tracker Prompt: “Maintain an experiment log with lead indicators of learning velocity (time-to-hypothesis, time-to-result, percent bold tests). Recommend when to pivot focus as the bottleneck moves.”
-
Reddit Pain Scanner (automated weekly) Prompt: “Weekly, pull top new posts in r/{{sub1}}, r/{{sub2}} matching ‘can’t, broken, stuck, alternative, migrate, budget.’ Summarize emerging pains, quotes, and propose one new experiment per theme.”
-
RLS-to-Lever Playbook Prompt: “Given the current RLS is {{driver}}, suggest 10 levers that directly address it, with expected metric movement, time-to-learn, dependencies, and first instrumented step.”
-
“Poke the Pain” Ad Generator Prompt: “Create 5 ad concepts that intensify Struggle for {{segment}} (pain, consequences, desired end-state), each with headline, primary text, visual concept, and landing CTA aligned to the same stage.”
-
Comparison Page Blueprint Prompt: “Draft a {{Product vs. Competitor}} page outline addressing Selection criteria: use cases, side-by-side features, proof, switching plan, price transparency, and objection handling.”
-
Migration Plan Generator Prompt: “For users switching from {{alternative}}, produce a 5-step migration guide, checklist, timeline, and reassurance copy to lower switching costs.”
-
Experiment Ethics & Risk Check Prompt: “Assess this experiment for ethical, brand, and legal risks. Suggest safer variants that preserve learning while protecting users and data.”
-
Benchmarks & Sanity Checks Prompt: “Provide industry benchmarks for {{driver}} in {{market}} and company stage. Flag where we are out-of-band and suggest plausible ranges for targets.”
-
Event Naming & Data Contract Prompt: “Create a consistent event taxonomy for our funnel. Define names, properties, types, and versioning rules. Include examples and anti-patterns.”
-
Scaling Decision Heuristic Prompt: “Given pilot results, compute expected ROI, saturation limits, unit economics, and ops load. Recommend ‘scale/iterate/kill’ with thresholds and leading indicators to monitor.”
-
Founder Reality-Check Prompt: “List our 5 riskiest assumptions about customers/channels/pricing. Propose bold tests that could falsify each within 2 weeks and <$2k.”
Highlights
No Prizes for Effort
If you look back at the early days of any great startup, you’ll see that 90% of their growth came from 10% of the stuff they tried. Some famous examples:
Airbnb wrote a script to automatically post each new listing to Craigslist bringing them loads of free qualified renters.
PayPal wrote a script to message eBay sellers, pretending to be a buyer, to ask if they would accept payments via PayPal. Sellers thought their buyers wanted PayPal, so they quickly added the payment option.
Canva created thousands of SEO-optimized pages with design templates and tutorials because they realized many basic design tasks start with a Google search like “award certificate template.”
Facebook and LinkedIn created an onboarding process in which new users automatically invited friends and colleagues to join.
Early growth at startups comes down to a few insanely successful tactics. That’s no coincidence; it’s physics: a startup needs a small number of people to deliver enormous results with only a little time and money.
In one pitch meeting after another, I saw every startup making the same mistake—missing big opportunities and recycling a tired list of basic growth ideas that would never amount to much. Instead of finding big levers, they were pulling the small ones harder and hoping for the best.
These founders are easy to spot because the intro email says something about buying me coffee to “pick my brain.” But when we meet, they spend 80% of the time talking instead of picking. When I do suggest something, they already have a list of reasons it would never work, even though they haven’t tried it.
Note: Ugh, these people… Don’t be that guy
These founders are easy to spot because their website promises an “All-in-one solution for…” That’s because they spent the past 3 years building features based on their “sense of the market,” and now the product is too complicated to even describe, let alone use. And the engineers spend most of their time managing technical debt for a handful of customers.
Each new feature you build, each campaign you run, each project you try makes the business harder to run: a larger codebase, a more complicated user experience, a harder product to explain and sell, more legacy customers and use cases to support. That complexity slows you down when you need speed above all.
Note: Never thought about it this way
But startups aren’t ready to optimize. They still need to figure out the basics, quickly. And while strategizing, executing, hiring, and delegating are great ways to optimize, they’re inefficient ways to learn. When fast learning is the goal, you need a different process—a process of discovery.
A startup needs to discover, as quickly as possible, who will buy their product, when and how they’ll use it, where they’ll look for it, and how they expect it to work. Only then is it possible to find big growth levers. They need to shift into discovery mode.
Note: Prompt/ agent idea?
You’re in a race to acquire and validate information about the system as quickly as possible. Your success depends on the pace and quality of learning.
Optimization pursues marginal gains. But discovery isn’t about getting marginally better; it’s about becoming categorically different. Google didn’t beat Yahoo by being 1% better. The iPhone wasn’t 1% better than a Nokia 6300, and Netflix wasn’t 1% better than Blockbuster. These startups succeeded by finding an entirely new approach, not nudging along an existing one. Their desired outcome wasn’t incremental but binary. Optimization can’t yield binary outcomes like this. Discovery demands a totally different kind of thinking. Instead of doing 100 things 1% better to get a small advantage, you’re looking to do just a handful of things really well to quickly dominate an underserved market.
The winner will be the first to figure out how to do it right. It will be the first team to figure out all the thousand little things that will make this a successful business. Your product and engineering teams need to discover user requirements to define the ideal product. Your sales and marketing teams need to figure out where to find loads of customers and how to attract them. Your support team needs to figure out what problems customers will have and the most efficient way to address them. Your compliance team will need to figure out how to satisfy legal requirements quickly without burdening your customers or employees. And somebody will need to figure out how to turn all that customer enthusiasm into a solid, predictable stream of revenue. Bottom line, your success depends on your ability to figure out lots of things quickly—your team’s ability to discover.
Note: Let’s take apple as an example. They made it such that the product is desirable. On the outside it looks like they just made something cool and people want it. But the reality is probably they worked very hard on those problems tirelessly and they hit the spot. It looks so easy from the outside
hard work is not enough. The success of any startup depends on the pace and quality of learning. Therefore, to succeed, an early-stage startup needs to become an instrument of discovery.
The Solution: Discovery Mode
At the highest level, there are four steps to becoming an instrument of discovery:
Step 1: Understand the journey that leads customers to you.
Step 2: Map your growth model to find points of leverage.
Step 3: Run growth sprints to test ideas quickly.
Step 4: Shift your team’s mindset from optimization to discovery.
Step 1. Understand your customer’s journey
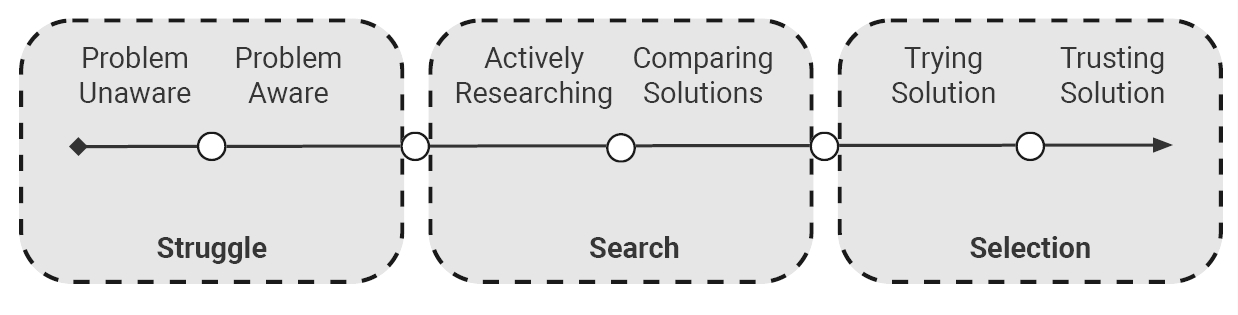
Your customers’ journey begins long before they realize they need your product. It starts with problems they’re trying to solve or goals they’re trying to achieve. It continues through researching and comparing possible solutions and ends with them choosing one. I call these stages in the journey Struggle, Search, and Selection.
Struggle: Every action we take, product we buy, and decision we make is fueled by some kind of struggle—either a problem to solve or a goal to achieve. Often, we’re not consciously aware of these struggles and goals, but we’re still busy trying to overcome them. You’ll need to figure out what struggles initiate your customers’ journey.
Search: At some point, your customers will take action to reach their goals. They may start looking for information, or they may already have an idea that they’ll go ahead and try. You need to understand why they spring into action when they do. If they’re looking for information, you want to know where they look and make sure you’re the one providing it, and if they’re trying something, you want to make sure it’s your thing.
Selection: Before your customers feel comfortable choosing a solution, they’ll have some specific questions and worries that need to be addressed, along with some switching costs—non-financial factors that make it hard for them to adopt your product. Examples include needing to learn a new skill or getting “stakeholder buy-in” from a coworker or spouse.
You’ll have prospects at every stage of this journey and will deploy different tactics at each stage. For example, if a customer isn’t particularly bothered by the struggle, you might run ads that “poke at the pain” to prod them into action. Or, for customers who are already comparing solutions, you might talk about the distinctive advantages of your solution versus the popular alternatives (e.g., “no coding required”).
When you understand customers’ struggle, search, and selection, you’ll start uncovering promising growth ideas.
Note: Damn, so many various and interesting tactics. Prompt idea?
How about a flow where I ask perplexity to analyze reddit for people problems for any given startup idea providing helpful feedback for user on how to focus on growth
Step 2. Map your growth model
A growth model is a flowchart that maps out how your business finds, acquires, and delights new customers. It will show you where your limited resources can have the greatest impact, mathematically, on your growth.
In most startups, teams compete for scarce resources: sales, marketing, and product all want cash and engineering, and those debates bubble up to the founder. A growth model will help your team align their work toward a common goal and provide a framework for everyone to agree on priorities without having to escalate every resource decision to the founder. It also enables you to spot bottlenecks that need unblocking and feedback loops that need to be nurtured.
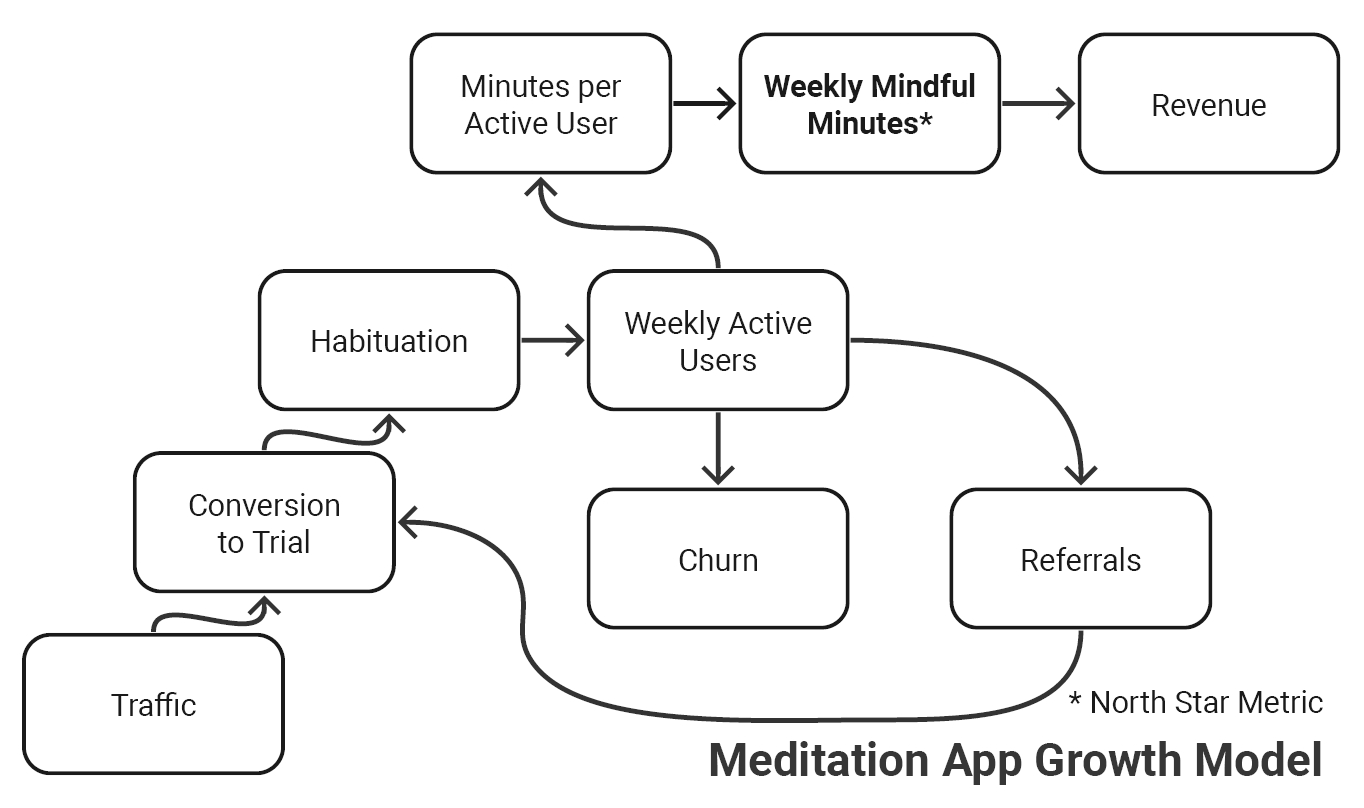
Below is a simple growth model for an imaginary meditation app.
The model looks simple, but agreeing on the right metrics to include is tricky.
Step 3. Run growth sprints
A growth sprint is a process in which you prioritize ideas with the greatest potential upside (regardless of cost), and then rapidly test the most promising ones with experiments. Each experiment aims at testing a specific hypothesis. These go beyond simple A/B tests; you can use them to validate new product or feature ideas, possible new customer segments, or even business processes, like the experiment I described from PayPal where we contacted high-value signups.
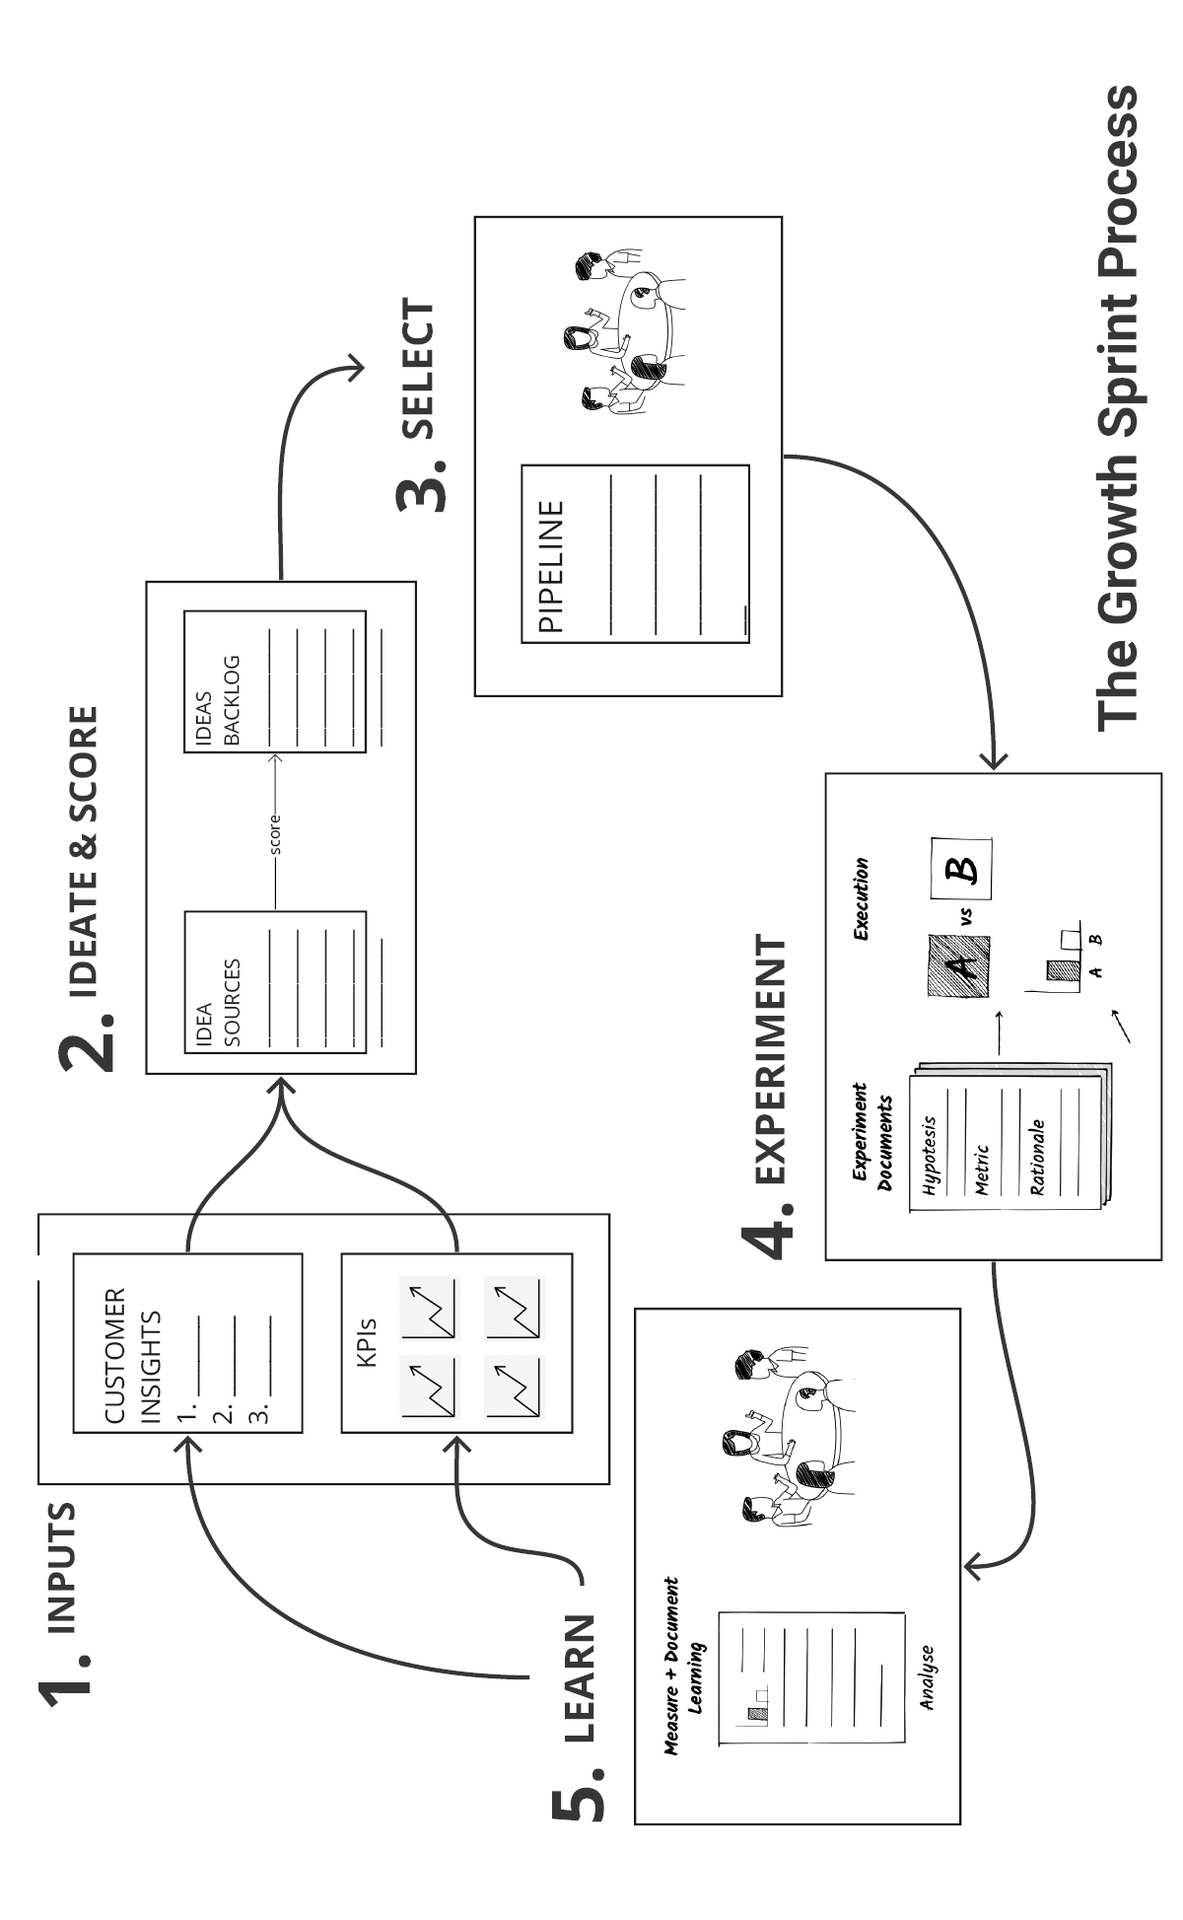
Most of your experiments will fail. But your aim is to learn from every experiment—especially the failures. If the experiments are well designed, failures will help you eliminate bad options and focus your efforts. With enough persistence, patience, and a bit of luck, you’ll find winners, and your data will give you the confidence to double down on them. The diagram below outlines the steps of a growth sprint.
Step 4. Shift the mindset
Steps 1–3 are the practical steps to finding your growth levers. But remember: spotting those levers is fiendishly hard. It requires shifting from an optimization mindset to a discovery mindset. That mindset shift often makes people uncomfortable. But without the mindset shift, the rest of the process can’t work.
Understanding the Customer Journey
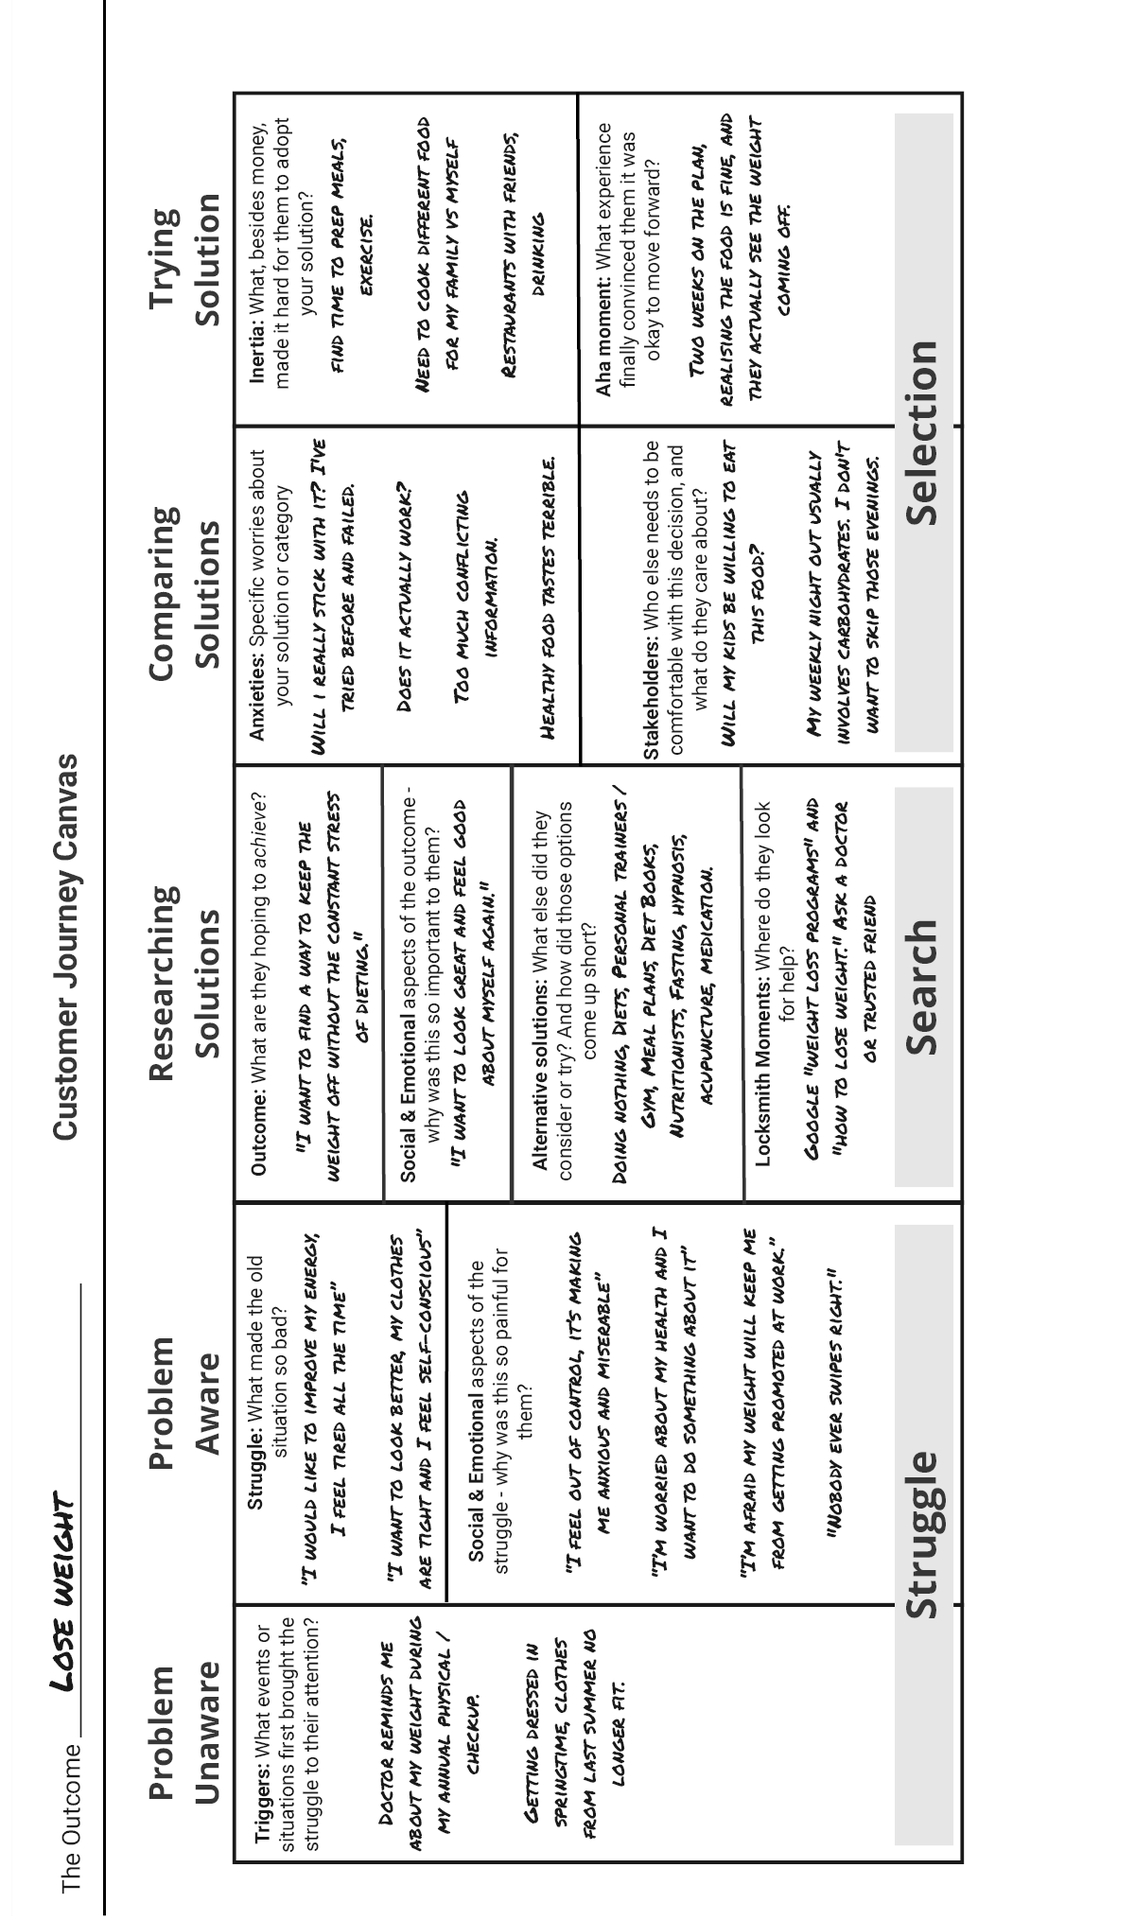
Customer journeys have three stages: Struggle, search, and selection. Each stage has two phases. You’ll have potential customers, and potential opportunities, at each phase. So it’s important to understand each one. Let’s take a quick tour using the example of a weight loss app.
Note: Great prompt idea to help figure out how would a customer feel / think about problems that my company is trying to solve
Jobs To Be Done Interviews
It’s a cool story. But was the information useful? Did Bob find a way to sell more houses? What clever “growth hack” did the story inspire?
After the interview, Bob suggested his company start advertising their houses in the obituary section of the local newspaper, and it worked: they increased house viewings by 38% and reduced their ad spend by 70% since nobody else wanted to advertise in the obituaries.
To get results like Bob’s, you need to uncover the powerful emotional drivers of decision-making using the “Jobs to be Done” interview process.
Note: Finding true intensions of your current customers can help with finding new ones
Your aim in running a “Jobs to be Done” interview is to imagine the whole customer journey playing out in your mind as if you’re watching a documentary. You’ll try to visualize your customers’ experience in enough detail that you can imagine going through that experience yourself.
Try to find people who recently bought your product. New customers will remember the purchase journey best. And if they haven’t bought it yet, they won’t know the whole purchase journey, and they might not be qualified prospects.
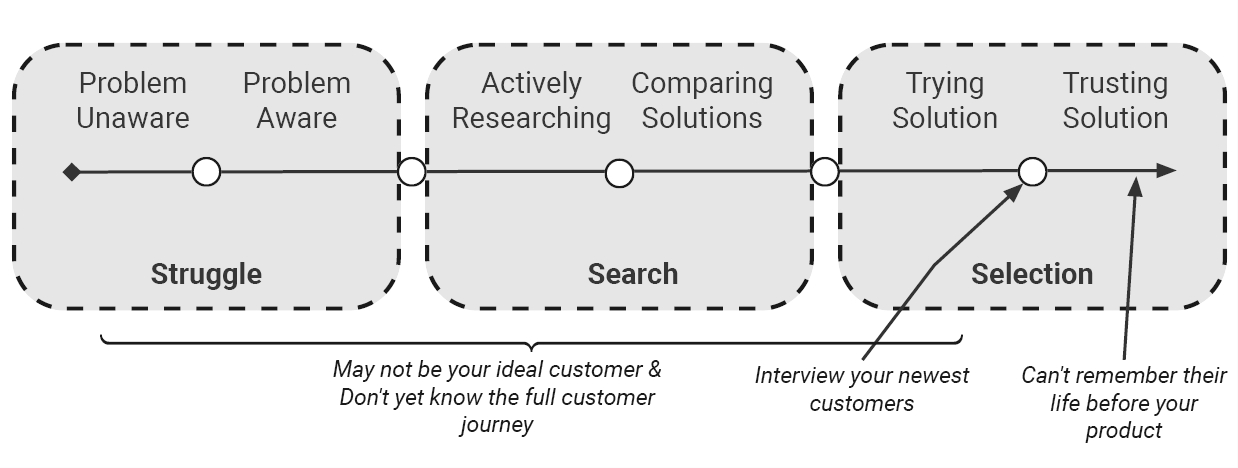
If your product hasn’t launched yet, find somebody who bought another product or service that helps them achieve the same goal. For example, they may have bought a competitor’s product or hired a freelancer to help them achieve the goal. Maybe they just bought a how-to book about the thing you help people do. The key is to find someone who doesn’t just talk about the goal, but has recently spent time and money on it.
Mapping Your Growth Model
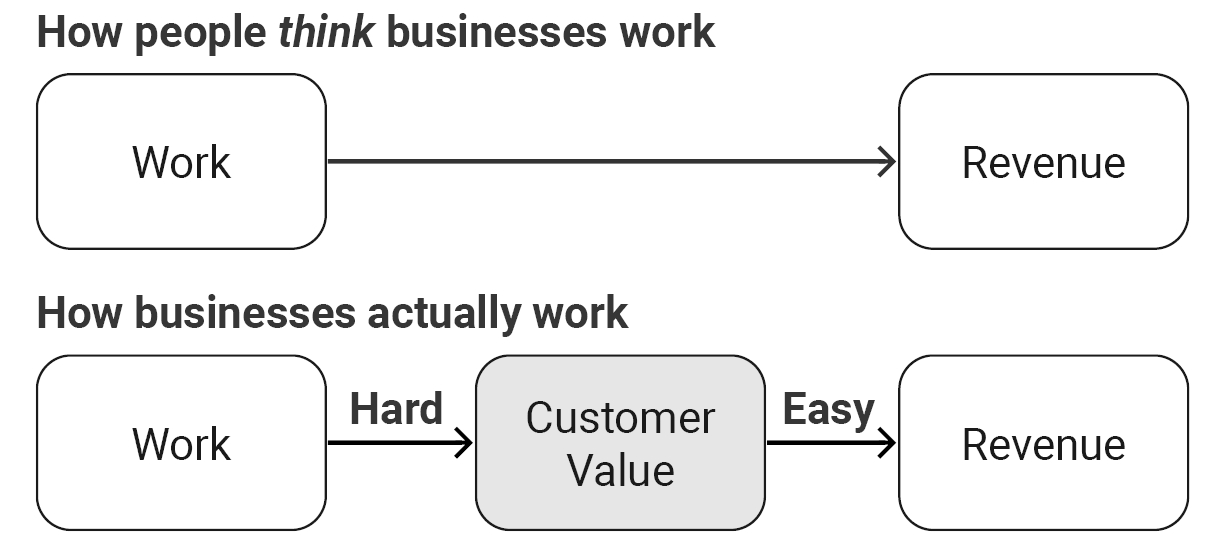
Of course, going into 2009, nobody could have foreseen this payments revolution. So, what could PayPal have done differently? Instead of a company-wide goal to “make money,” they could have prioritized acquiring and delighting more customers. Profit is an outcome of happy customers, not the other way around. And a growth model is a tool to help your team avoid PayPal’s mistake and prioritize the right work.
How to map your growth model
A growth model is a flow chart that maps out how your business finds, acquires, and delights new customers. It will show you where to invest your limited resources to have the greatest impact, mathematically, on your growth. And it will help everyone on your team make better decisions about which work they do.
You’ll map your growth model in 4 steps.
-
Find your North Star Metric (“North Star Metric”): the number that ultimately tracks value delivered to customers and causes revenue. This expresses your ultimate goal tangibly.
-
Find the key drivers that increase the North Star: from when people first encounter your business to the point where they’re happy, loyal, revenue-generating customers.
-
Identify your growth levers: the activities that could have the greatest impact on your key drivers.
-
Identify your rate-limiting step (RLS): where you can focus to have the greatest impact.
1. Find your North Star Metric (and why it isn’t revenue)
Here are some examples of “North Star Metric”s:
B2C: Usually a number of transactions or users or an amount of usage
• Facebook – Daily active users
• Amazon – Repeat purchases
• Spotify – Time spent listening
B2B: Usually a number of users or an amount of usage
• Slack – Daily active users
• Salesforce – Records created
• HubSpot – Weekly active teams
Marketplace: Typically a transaction metric where both sides of the marketplace come together (e.g., buyers and sellers, workers and employers)
• Airbnb – Nights booked
• eBay – Gross merchandise volume
• Uber – Rides per week
You can stress test your “North Star Metric” with this checklist:
-
Aligned incentives: Does it increment when you deliver value to your customer? And if you succeed in moving it, will your company earn money and grow?
-
Full funnel: Does it represent the results of optimizing your entire customer journey from first contact through retention / churn? Or are parts of your operations left out?
-
Absolute number: Can it keep increasing forever? Avoid ratios and percentages as a North Star.
-
Simple and memorable: Will everybody in the company be able to understand and remember it and use it to guide their work?
2. Find your key drivers
Key drivers represent the results of the work people do to move the North Star, but not the work itself.
For example, you could break a measure of weekly active users (WAUs) into three drivers: signups, activations, and retention. To improve activation, you might do live customer onboarding calls, simplify your product flow, and email tutorials. But your key driver isn’t the work; it’s the outcome. So the key driver isn’t “number of onboarding calls completed”; it’s “activation rate.”
This distinction matters. If you measure the wrong thing, people might hit their targets without having any business impact. It’s better to charge them with the outcome and ask them to figure out how to get there. As Steve Jobs said, “It doesn’t make sense to hire smart people and tell them what to do; we hire smart people so they can tell us what to do.”
3. Sketch out your growth model
Once you’ve found your key drivers, you can illustrate your growth model with a simple diagram that helps everyone understand how the business works.
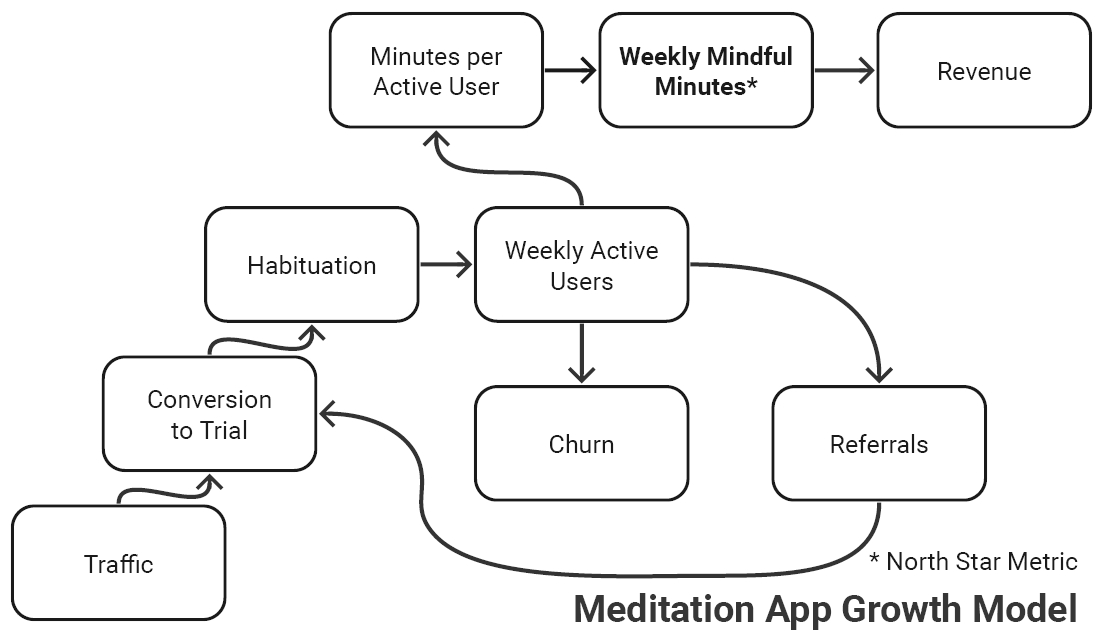
The growth model for this imaginary app runs from bottom left to top right. The boxes represent absolute numbers: the number of website visitors, conversions, and churned users. The arrows represent conversion percentages, like the conversion rate from visitor to trial user.
It takes iteration to settle on the right metrics. It would be easy to build a model with off-the-shelf metrics like “visit,” “install,” “signup,” and “activation.” But off-the-shelf metrics only describe customer actions, not the mental shifts that motivate those actions. Useful key driver metrics often track patterns of behavior that indicate a shift in the user’s beliefs about your product.
Key drivers change as the business matures. For example, I once worked with a direct-to-consumer educational business that improved their visit-to-signup rate 17X from 1.5% to 25% with a single experiment. (If you’re curious, they switched from dropping visitors straight into the product to featuring a signup button.) The next day, they moved their focus from signup conversions to activation because most of the new signups were passive. When you make major progress on one of your key drivers, pick a new one to attack. I also recommend revisiting your key drivers quarterly, whether or not you’ve made progress on them, and reconsidering your approach.
4. Identify your growth levers
We’ve finally reached levers, the subject of this book. Once you agree on two or three key drivers, direct your attention to the work needed to move each one. We’ll call that work a “lever.” Work with your key-driver owners to identify the most promising work and give each lever a metric.
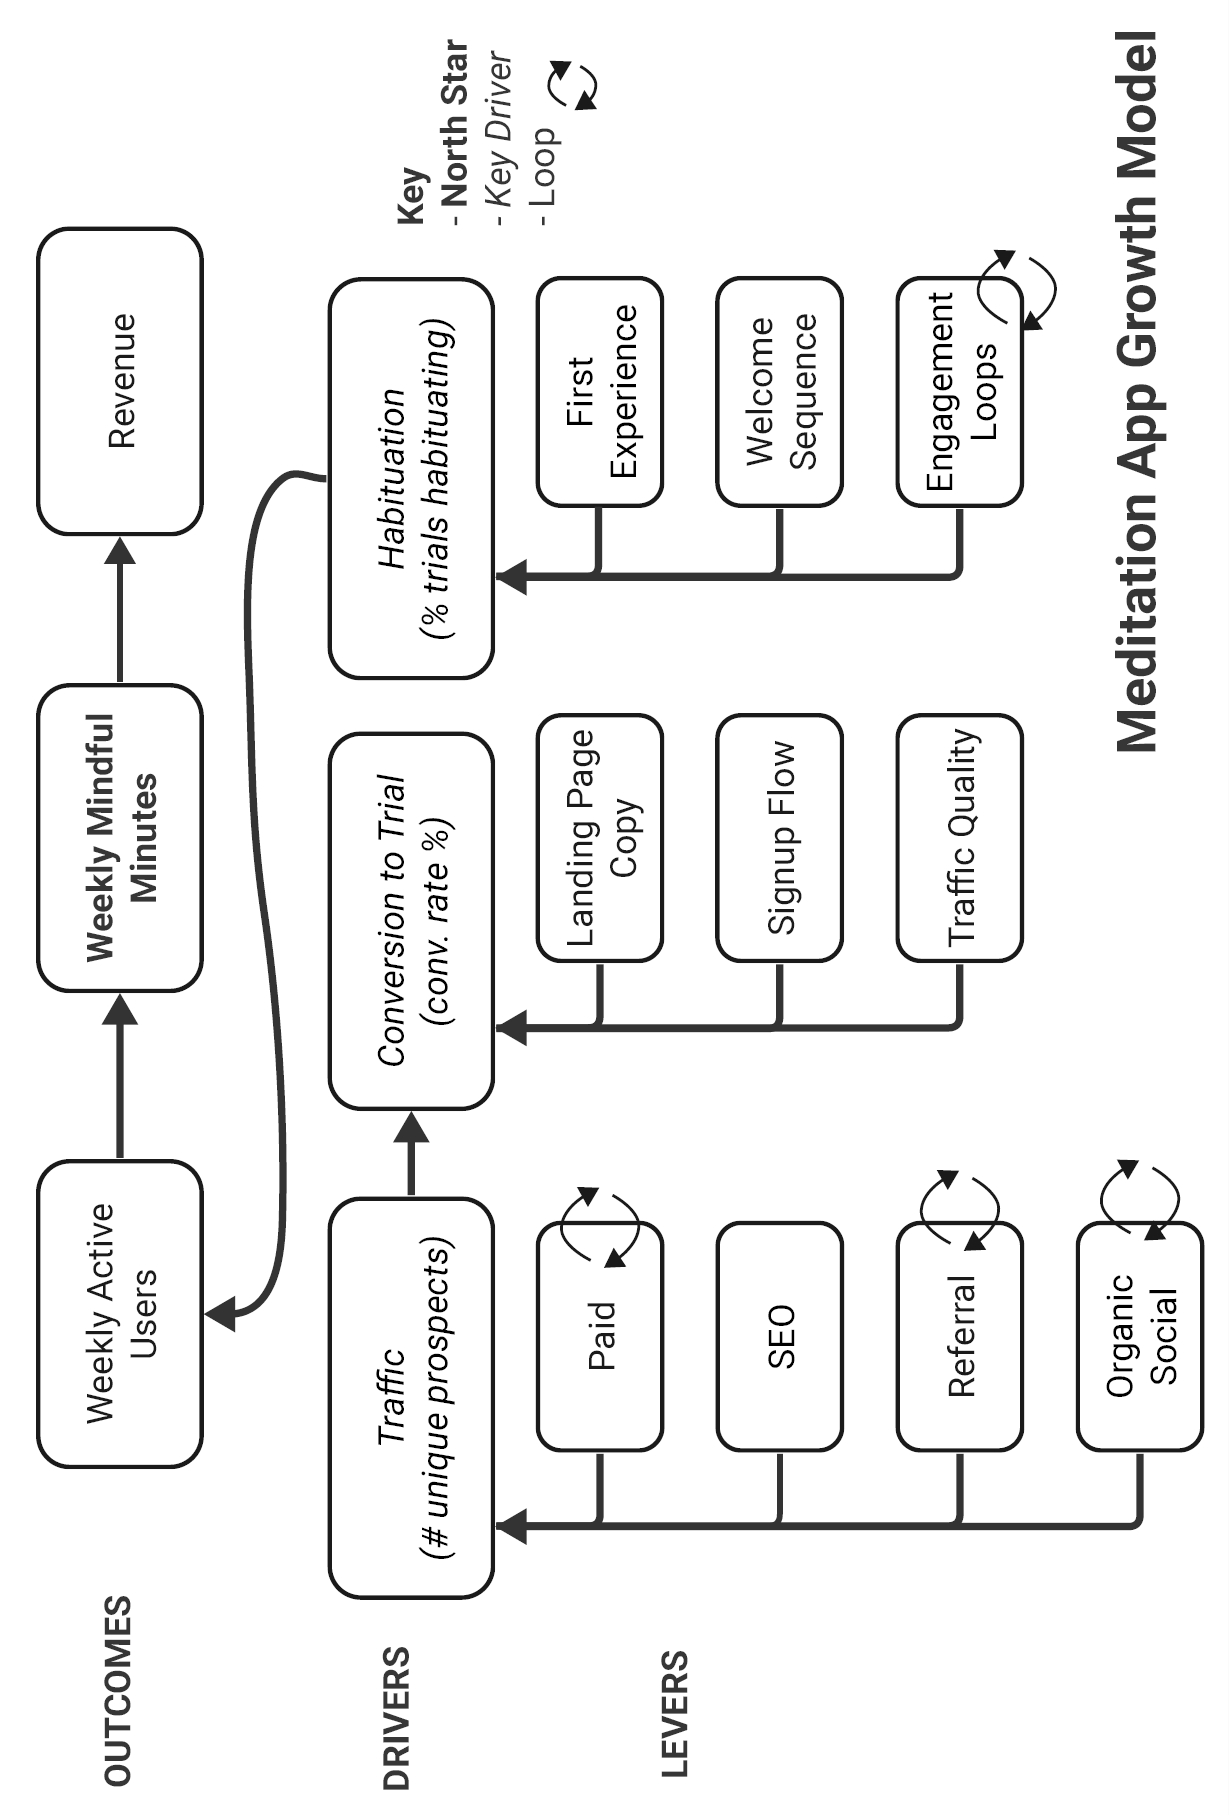
Your growth levers are all the work you could do to improve your key drivers and boost your North Star. Each lever gets a metric that tracks the results of that work in terms of customer behavior.
As you’re defining your metrics, create a simple dashboard with your North Star on top, followed by key drivers, then nuance metrics that provide any additional data to explain movements in your key drivers. The dashboard gets more granular as you scroll down, like this:
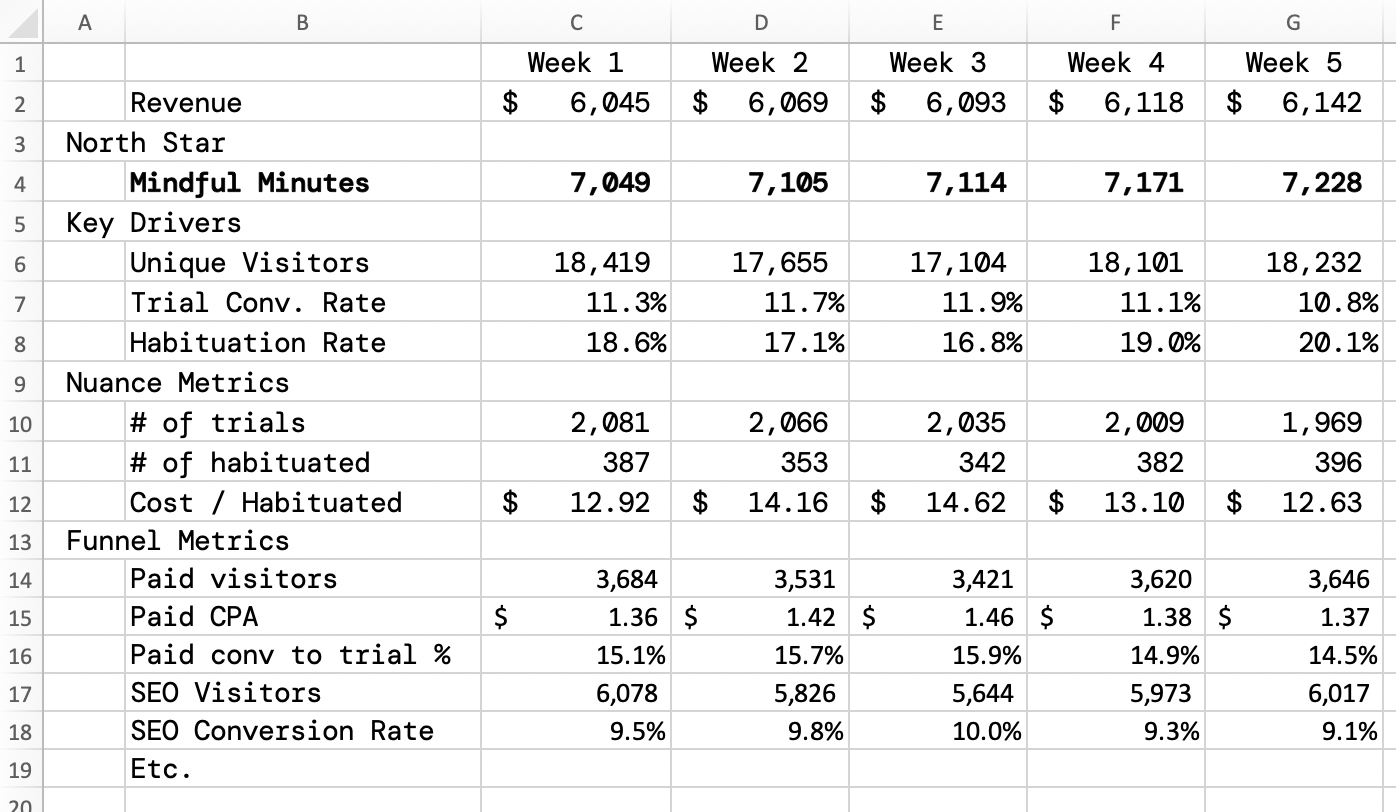
It takes iteration to find the right metrics.
Here are a few questions to help you decide which key drivers to prioritize:
• If it works, can it be really big? Or will it only ever cause incremental growth?
• How good or bad is your metric compared to relevant benchmarks?
• Will working on it help us learn something important?
• Does it cause growth or merely correlate with it?
• Does it take advantage of your strengths as a team?
• Is it part of a positive feedback loop? Can it become self-sustaining?
• Is it a bottleneck that slows down other parts of the system? (If you improve it, will the whole system run faster?)
5. Find your rate-limiting step (RLS)
Now that we have our growth levers, we need to find the big one. To do that, you’ll study the data and find your rate-limiting step: a bottleneck that constrains the overall growth rate of your business. If you address your rate-limiting step, the business will grow faster. If you focus resources anywhere else before removing the rate-limiting step, your efforts will have limited impact.
A good way to isolate your RLS is to ask: “If we double our performance in this area, will we double the business?” When you find a rate-limiting step, make it your top priority and allocate the right people against it, regardless of their job title.
Using your growth model to do fewer bigger things
The growth model is a tool to improve how your team prioritizes work. First, it encourages everyone to work smarter, prioritizing the 10% of ideas that can generate 90% of our results. Second, it helps everyone in the company align themselves around that critically important work, rather than thinking in the constrained terms of their job function. Here’s a simple process to push everyone’s thinking.
Finally, incentives don’t work if nobody can see the numbers. So, put your North Star, key drivers, and variance to target in a simple dashboard that you share with the team regularly.
Running Growth Sprints
Growth sprints have six steps:
-
Inputs: Gather your customer insights and the data in your growth model, plus any past experiments or ideas.
-
Ideation and Scoring: Triage your ideas to create a shortlist for consideration in the current sprint cycle.
-
Selection: Select the most promising ideas to test.
-
Experiment: Design and run your experiments.
-
Learn: Learn from the experiments, document, and share your takeaways.
-
Repeat: Update your thinking with this new information, return to the backlog, and figure out what to test next.
Looking at the list of ideas, score each one quickly on three factors:
-
Key Driver: If it works, which of your key drivers will it most directly impact? Traffic? Conversion? Retention? Referrals? Activation?
-
Impact: If it works, how big would it be, on a scale of 1 to 5? For example, if you’re considering an SEO project, and the search term you’re chasing only gets 10 searches per month, that number limits the potential impact. Or if you’re considering changes to your pricing page, but only 2% of your traffic ever visits the pricing page, that change will only affect 2% of your traffic.
-
Effort: How much time, effort, money, and engineering would be required? Blend those costs into one number from 1 to 5.
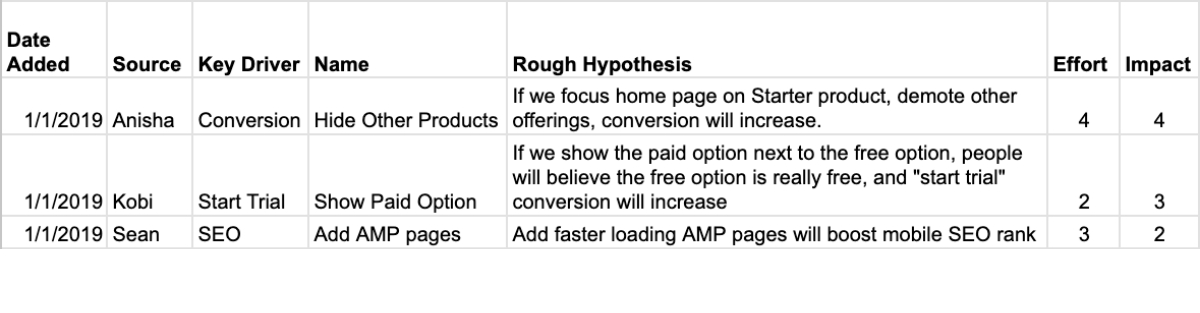
Here’s a screenshot of a growth idea backlog.
Estimate quickly. Don’t overthink it. It’s very hard to do this accurately, and it’s not worth the extra time and effort.
The scoring process will shorten your list of ideas, but you’ll still need to choose a few to test each week. Here are some prompts you can use to decide which experiments to run:
-
Which of these, if it works, could have the biggest impact?
-
Will we learn something important about our business or our customers? (Will this resolve an internal debate we’ve been having?)
-
Is there an easier way to get that information, such as studying our existing data, asking customers, or speaking to our salespeople?
-
Is the idea actually risky? Could it backfire? Or is it expensive in terms of money, time, engineering work, or some other scarce resource? (If not, maybe just do it rather than run a formal experiment.)
-
Do you have the resources and technological capability to run this experiment well?
Documenting your prediction helps clarify your thinking and eliminate hindsight bias. That way, no matter if your experiment succeeds or fails, it will make you a little bit smarter.
Does everything need to be an official experiment? We don’t always have the time, tech, or traffic to run a proper, controlled experiment, and that’s okay. Sometimes, “just do it and see what happens” is a perfectly good approach! But every project, whether you get a clear winner or not, needs to bring learning. Do the upfront thinking it takes to ensure you learn from your experiments—always start with a clear hypothesis and prediction.
Writing a hypothesis only takes a few minutes, and it’s a great way to clarify your thinking. Here’s the format:
The Risky Assumption: We believe that ______.
The Experiment: To test this, we will ______.
The Prediction: We predict that ______ (metric) will move by ______ units in ______ direction.
The Business Effect: If we are right, we will ______. Think: how will this change the way you run your business? If you can’t think of anything you’d do differently, it’s probably not worth running the experiment!
Start with a hypothesis that contains a single risky assumption that can be tested and measured. For example:
“We know that app users have better retention rates than web users, and we believe this is causation, not correlation. Therefore, if we encourage new signups to install our app after they register, rather than using our web version, it will increase our 90-day retention rates from 8% to 12%.”
The most common reason experiments fail is starting with a poor initial assumption. A good assumption contains a belief about your customer that’s rooted in some insights you gained from your data or customer conversations. The most common mistake is to draft a circular hypothesis like this:
We believe that if we lower our price by 10%, we will get more signups. Therefore, we will offer a 10% discount, and we predict our total sales will increase.
A circular hypothesis basically just says: “I have an idea, I think I’m right, so I’m going to try it.”
You’ll notice these are all negative hypotheses (e.g., “We believe prospects are not doing X because…”). A negative phrasing reduces the risk of writing a circular hypothesis. Statistical researchers always try to disprove a null hypothesis (e.g., we believe income and education are not correlated). Doing so reduces the risk of confirmation bias. Also, most growth experiments aim to convince people who aren’t doing a certain thing to start doing it. Ideally, those experiments rest on a theory about why they’re not doing it in the first place.
Write down your hypothesis and share it with as many team members as you can. Encourage them all to make predictions. It’s a fun competition that helps everyone learn about the business, your customers, and the experimentation process in general.
If the experiment works, great! Take the time to understand why it worked, and think about what you’ll do next. But most of your experiments will fail—or at least surprise you. (If they don’t, you’re not being bold enough!) But no matter the result, every experiment needs to make us smarter. So, take the time to look through the data, note any surprises, and discuss the results with your team. Each team member understands different parts of the puzzle. Some are experts on tech. Others are closer to customers, the data, or “best practices” in a field like product or marketing. Bring all their knowledge together.
Here are some prompts to consider the next steps:
-
Is there any value here? Should we expand, repeat, or scale this?
-
Is there anything we should now stop doing or cross off the list?
-
Are any follow-up experiments needed?
-
What implementation details should we change?
-
Do we need to change any of our KPI definitions?
-
Who else needs to know about this result?
-
Are there any operational takeaways about how to run experiments better in the future, e.g., tracking or experiment setup?
When experiments fail, the root cause is often a muddy hypothesis. So, for the next experiment, get very clear on your written hypothesis and success metric. Isolate one variable (e.g., message or targeting or price) and track the right metric. Or try testing bolder things that challenge your most important beliefs and assumptions about your customers.
Shifting the Mindset
You can agree on your North Star Metric and rate-limiting step, but you won’t get big results unless your team has the courage to de-prioritize incremental projects that are easy and familiar in favor of bolder, riskier ambitions. You can run experiment after experiment, but you’ll struggle to get a big lift unless you have the intellectual honesty to examine your beliefs critically and allow your riskiest assumptions to be tested.
The process doesn’t work without a discovery mindset.
The illusion of knowledge is essential to human survival. If we woke up one morning and suddenly saw all the uncertainties, risks, and possibilities we faced, we’d be so overwhelmed we wouldn’t make it to breakfast. But in situations like entrepreneurship, the illusion can blind us to important new information. It’s especially acute in entrepreneurs whose “vision” or “reality distortion field” are essential to building the confidence needed to challenge consensus beliefs.
shift from feeling confident that you have the right answer to feeling confident you can figure it out.
I interviewed some scientists for this book, including Dr. Supriya Srinivasan, neuroscience professor at the Scripps Institute. She has worked with several Nobel Prize winners, so I asked her how they’re different from normal scientists. “When something fails, a great scientist no longer questions their own ability or their mission,” she explained, “instead, they only question their approach and their level of effort.” That’s the discovery mindset in action.
A discovery mindset means overcoming imposter syndrome. When you work from a place of insecurity, you see new information as a threat. But new information is the currency of discovery. Great scientists build the confidence to push aside their self-doubt and run toward surprises. A discovery mindset means openness, experimentation, focus on customers and data, collaboration, bold thinking, and risk-taking.
Doing science involves asking great questions, formulating hypotheses, designing ways to test them, and persisting through repeated failure. We call both activities “science,” but they’re completely different. Often, students who are great at learning science struggle to do science because it’s too demoralizing.
When Nothing Is Working
I don’t know a secret, better way to grow startups than what I’ve shown you. Every great startup success I’ve studied used some variant of the process I’ve outlined together with a bit of luck. Unfortunately, progress is seldom linear. It’s more like Nothing… Nothing… Nothing… Bang! If you’re learning, you’re on the right path. Trust the process and stick with it.